Statistics
This section is only available for organization admins. It shows how actively members of your organization are using QAnswer over time.
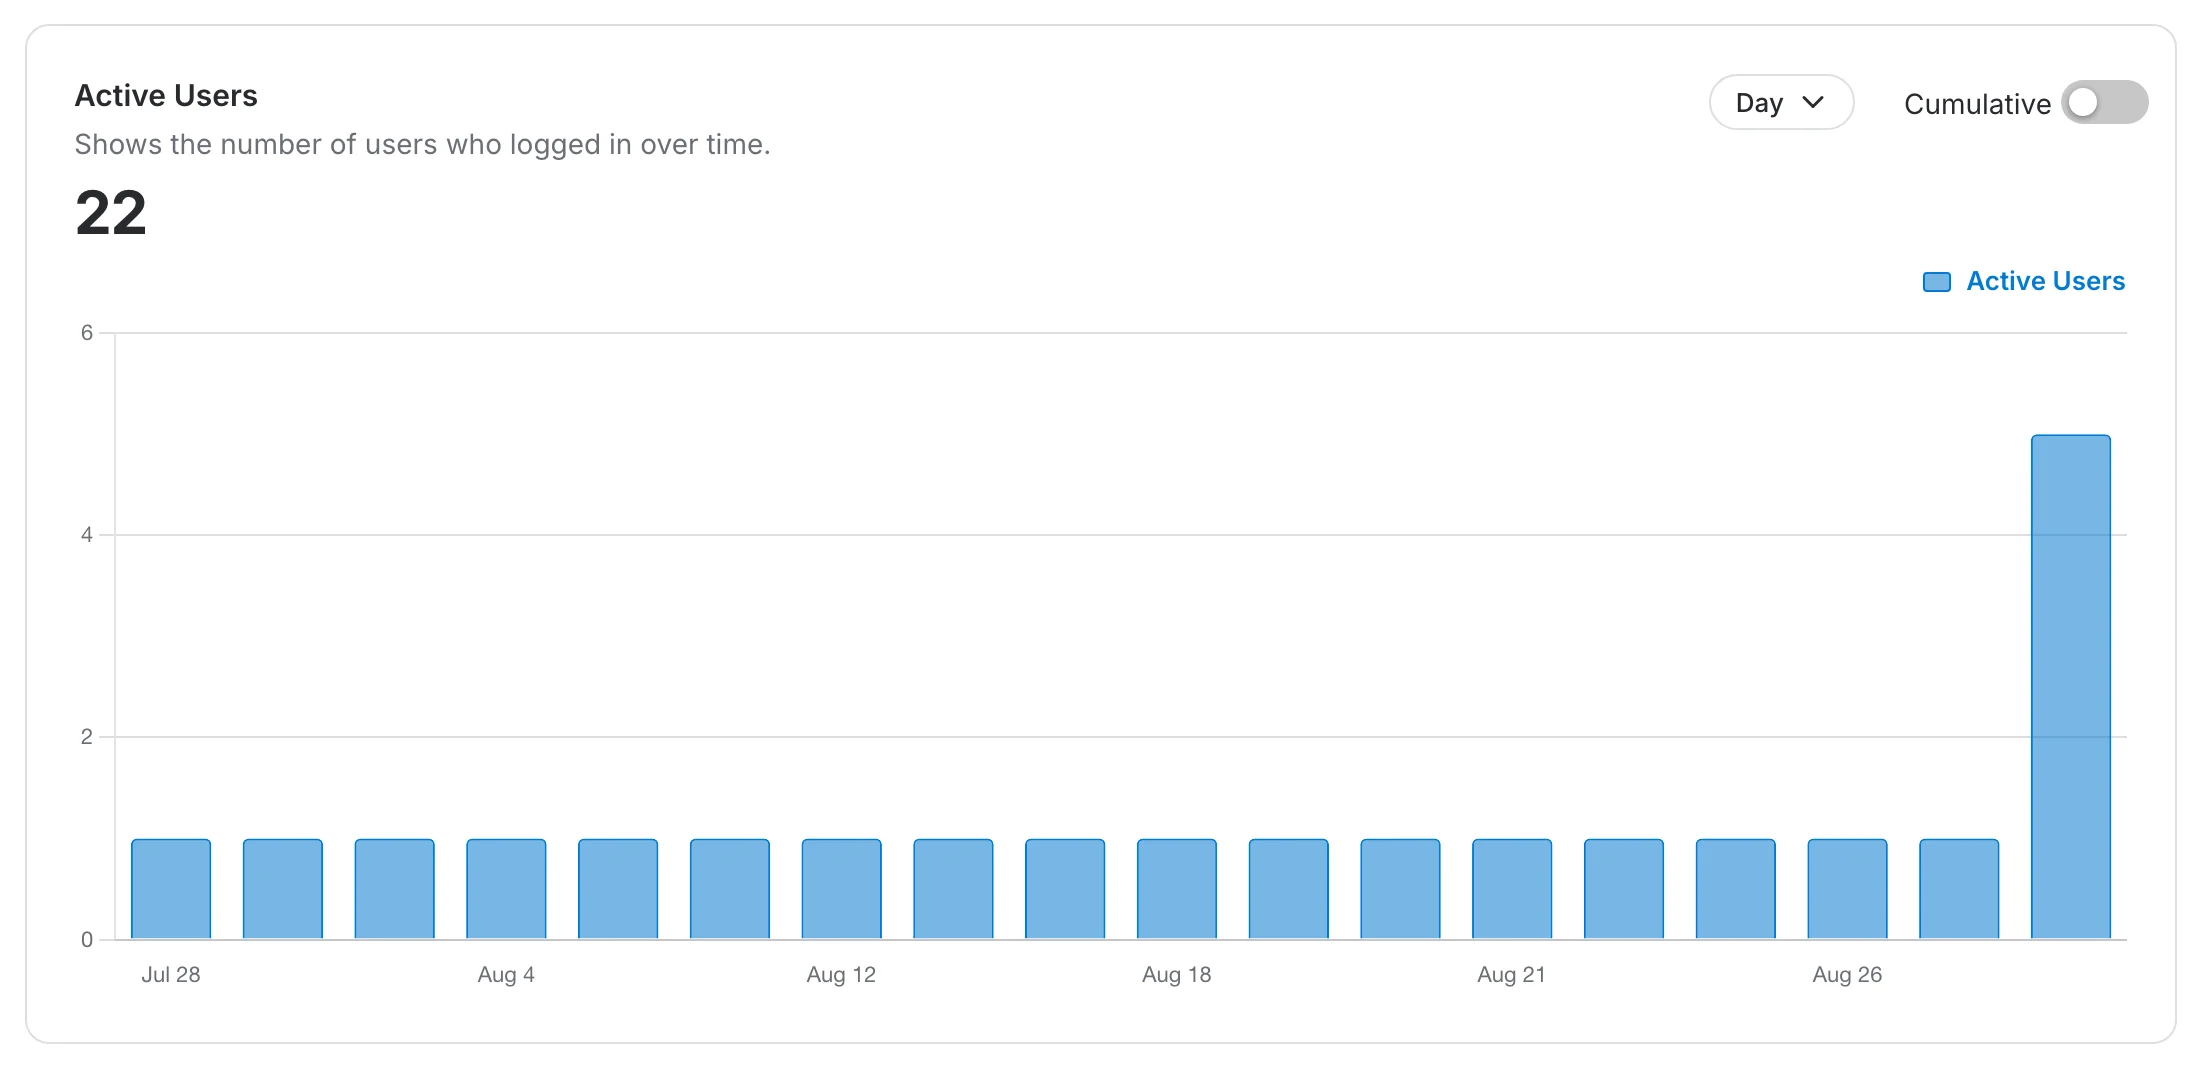
Active Users
The Active Users chart tracks successful sign-ins by members of your organization, so you can see engagement trends at a glance.
Use the time range control at the top of the page (Week, Month, Year, or All Time) to change the period the chart covers.
By default the chart shows the number of active users per period as bars. Toggle Cumulative to instead show a running total of distinct active users over time.