
Usage and Costs
The Usage & Costs page tracks how much the AI providers have been used and what that cost. It shows one headline figure for the whole page with a chart behind it, then one card per kind of provider — LLM, Embedder, Image Generation, Speech-to-Text and Web Search.
The page always reports on the scope you opened it from, so the figures cover exactly the providers that scope can see: your own consumption in a personal workspace, an organization's on its settings pages, and the whole instance from the Admin Panel.
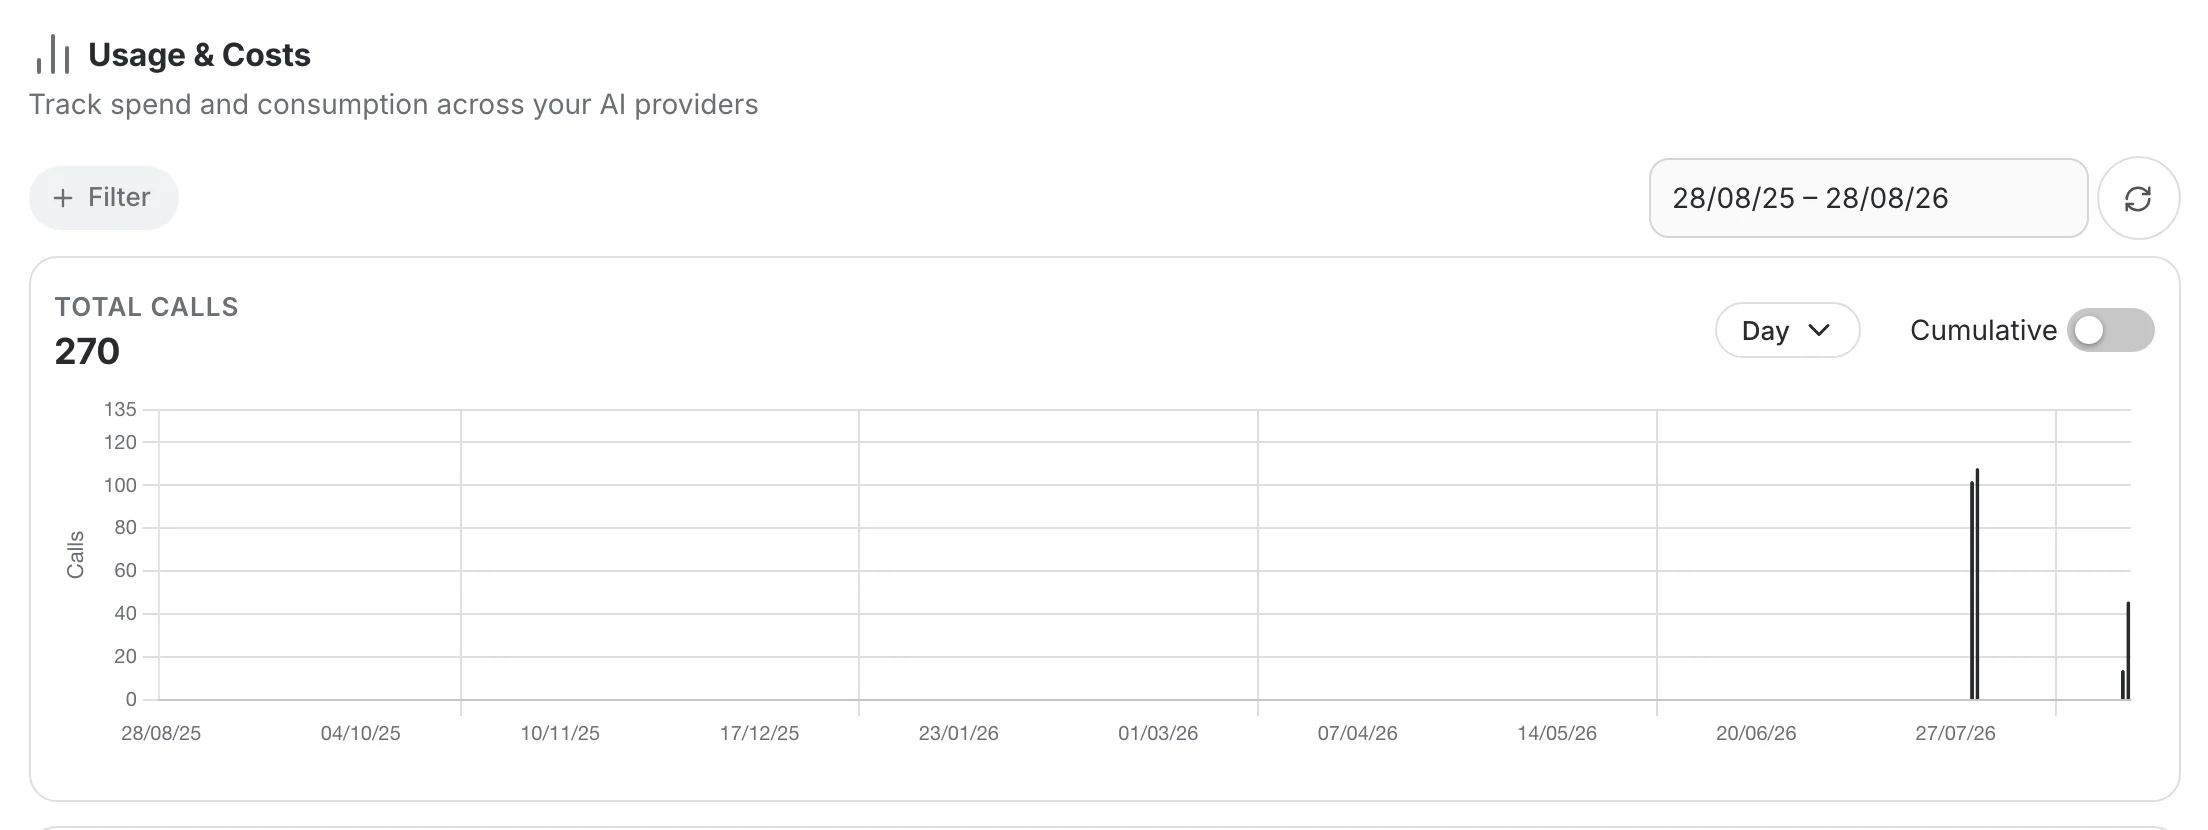
Filters, period and refresh
Everything in the bar at the top applies to the whole page — the headline card and all five provider cards at once. Open the Filter menu to narrow the report down to one organization, team, user, AI assistant or API key.
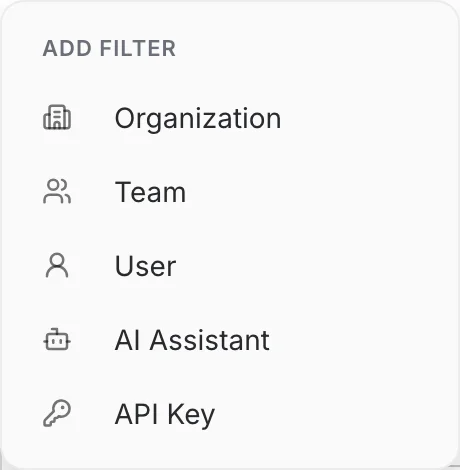
- Each filter you add becomes a chip. Remove one with the cross on it, or drop them all at once with Clear all.
- The scope the page is already bound to is not offered as a filter — an organization's own page has no Organization filter. Switching the Organization filter also clears any Team filter, since a team only means something inside its own organization.
- The date range opens on the trailing twelve months; clearing the field reports all recorded history. The refresh button reloads every provider with the filters currently set.
Total Calls
The headline card adds up the calls of all five providers over the selected period, and charts them together. Its Day / Month / Year control and its Cumulative switch belong to that chart alone — each provider card carries its own.
Provider cards
Below the headline, each provider kind gets a card. On the Chart view it plots every measure it bills for side by side, each chart titled and carrying that measure's total for the period.
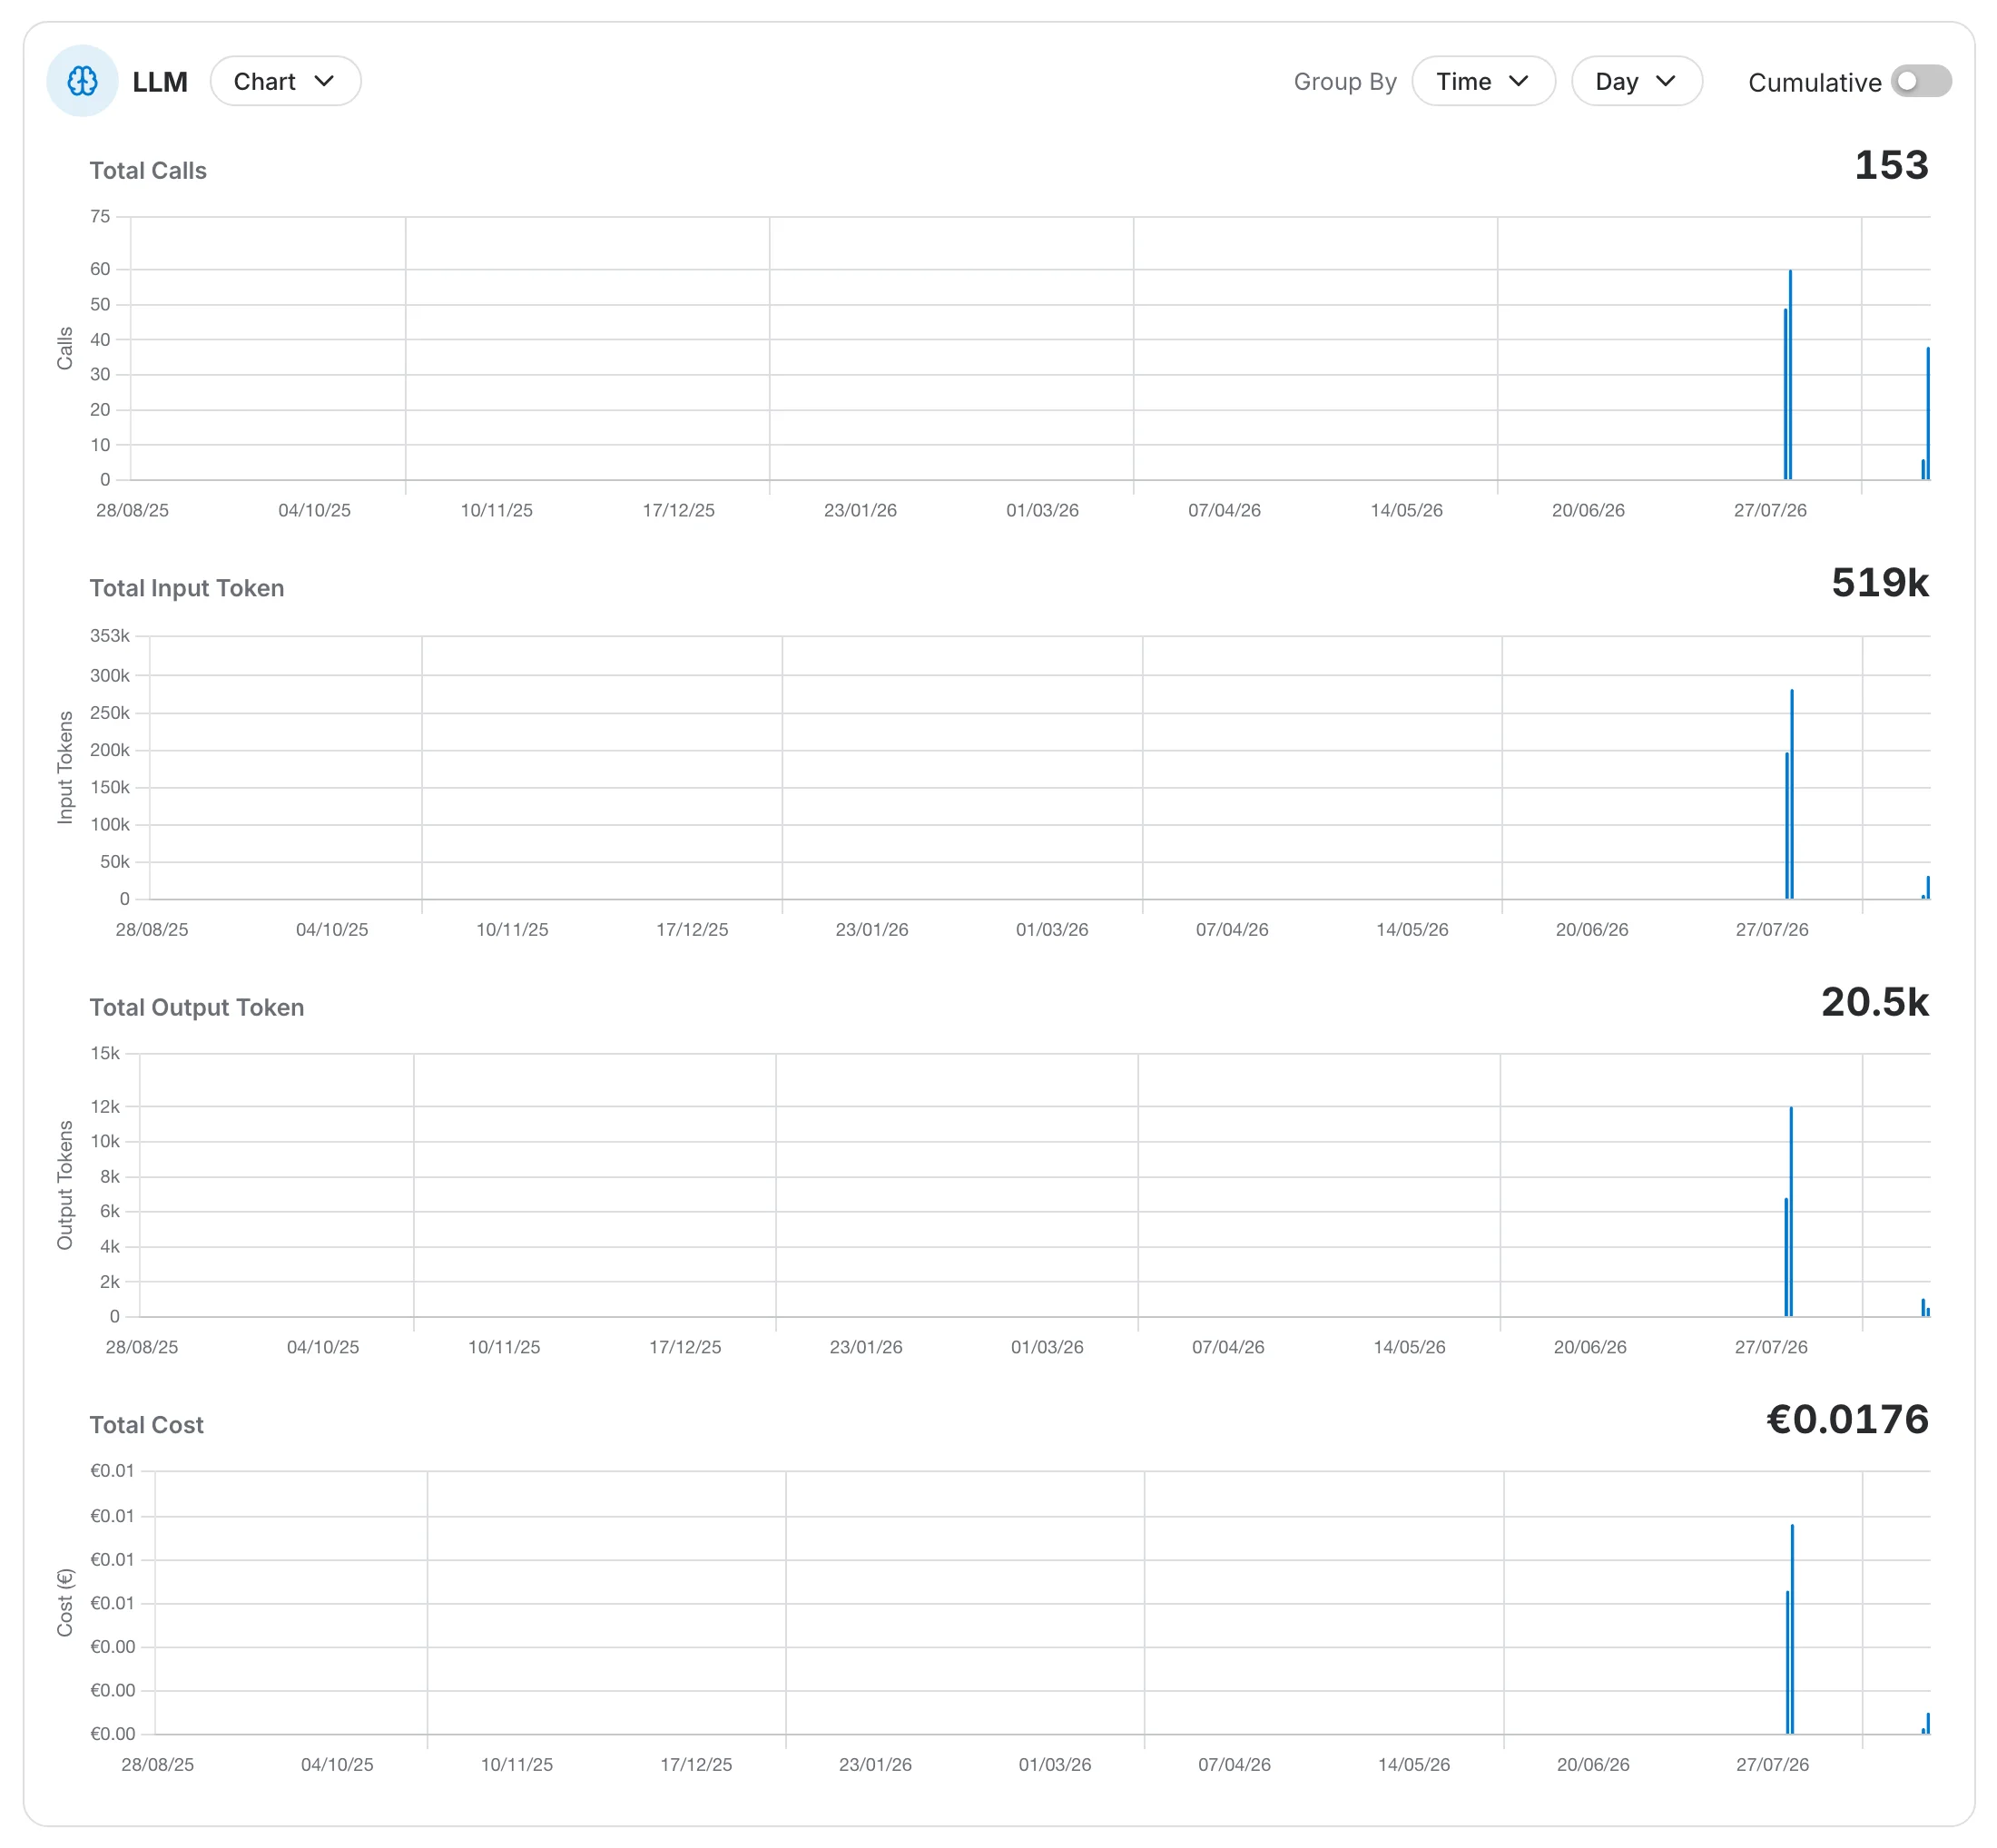
A card only charts the measures its provider actually bills for, so an empty token chart never gets mistaken for a provider that does not use tokens:
- LLM — calls, input tokens, output tokens and cost.
- Embedder — calls, input tokens and cost.
- Image Generation, Speech-to-Text and Web Search — calls and cost.
Every control on a card belongs to that card. Regrouping or paging one leaves the other four exactly as they were, and never moves the totals: they answer for the whole selected period whatever the card happens to be showing.
Group By
Group By switches what a card breaks its figures down by. Time keeps the charts as a series and adds the Day / Month / Year control beside it; the other options break the period down by entity.
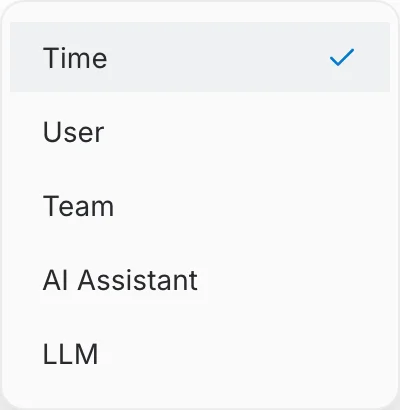
An entity grouping replaces the time series with a ranking, highest first, and adds a search box for finding one row among many. The granularity and Cumulative controls disappear with it — a ranking is a snapshot of the period, not a sequence through it.
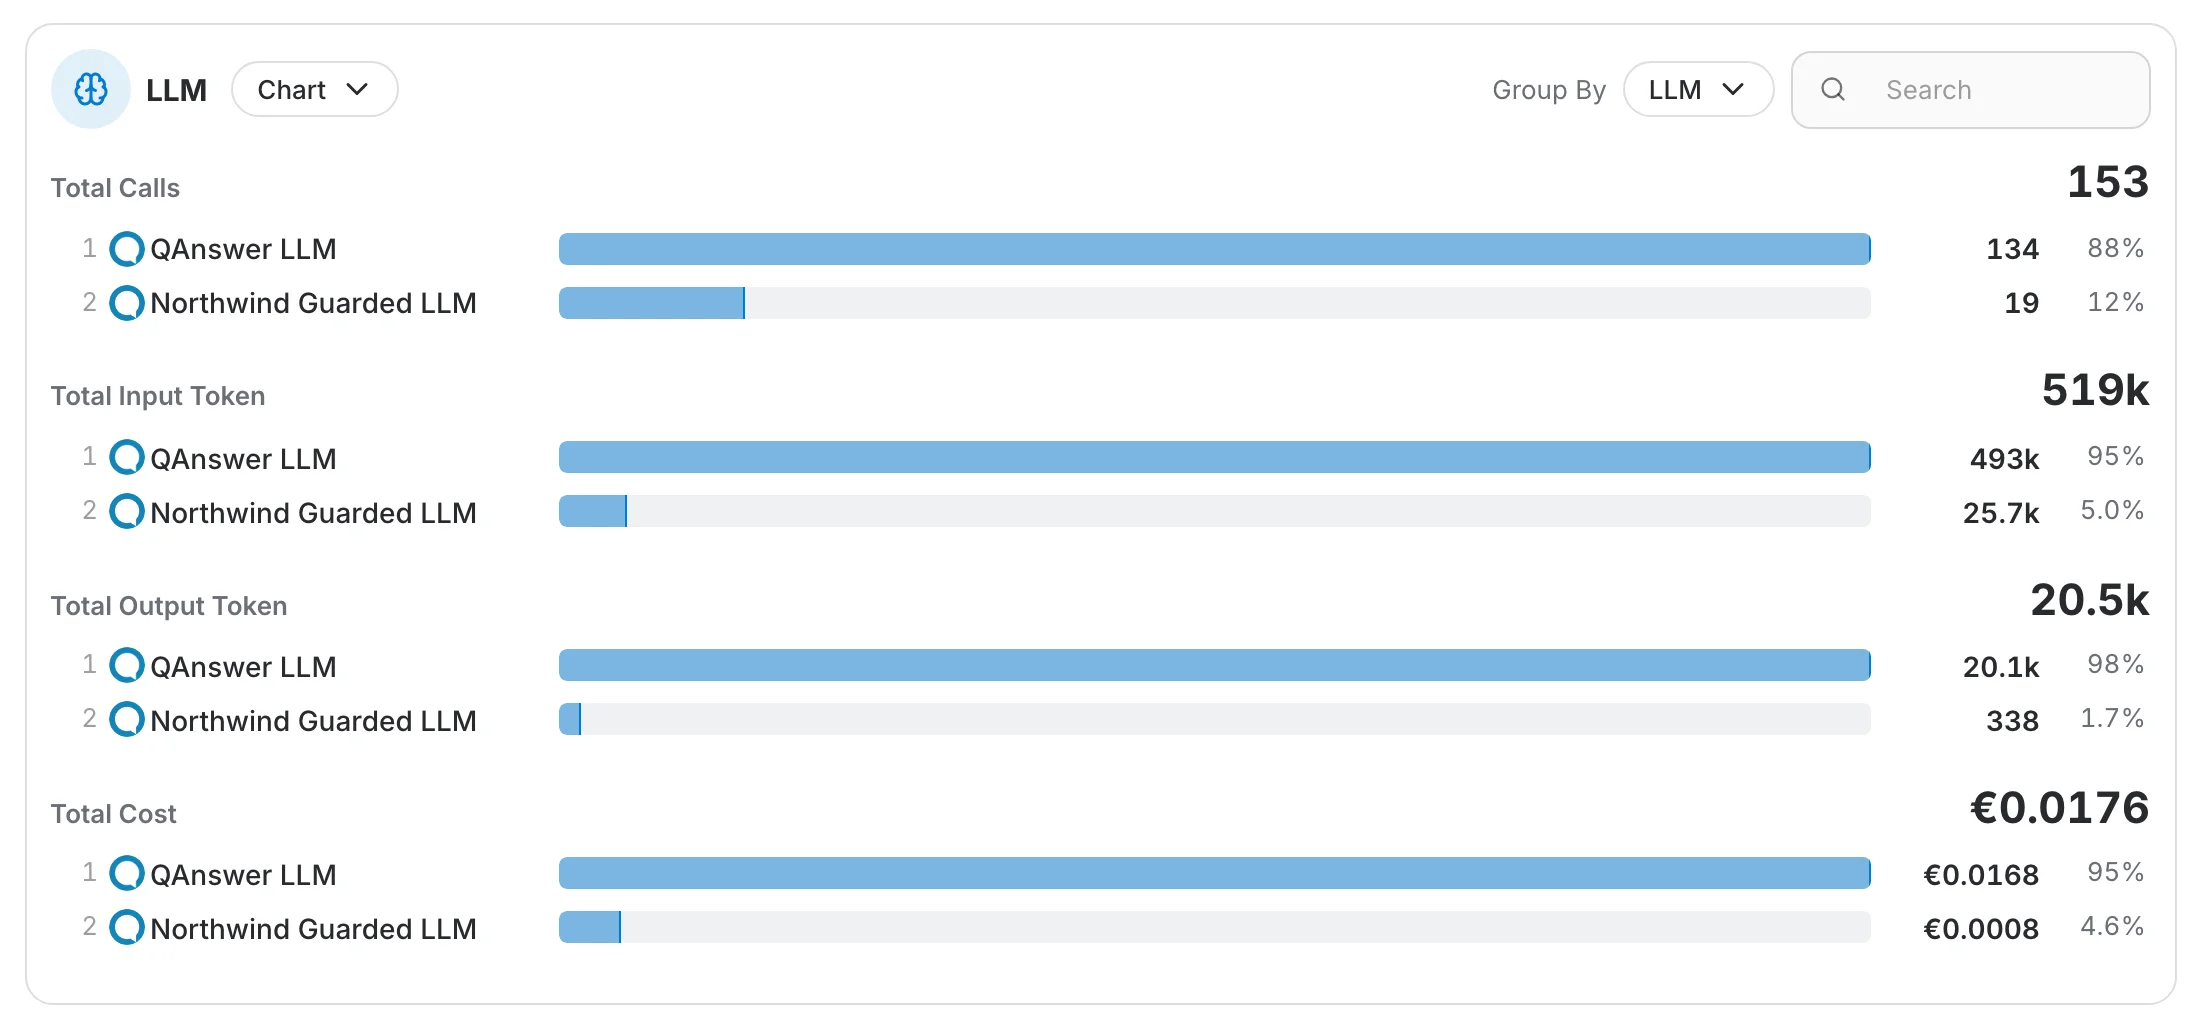
Group by LLM to see which models are actually driving the bill, or by user or AI assistant to see where the consumption comes from — and by team when the page sits inside an organization, which is why the platform-wide page above offers no team ranking. A card only offers the groupings it can resolve to names, so the model grouping appears on the LLM card and the provider grouping on the Image Generation one.
Table view
Switch a card from Chart to Table for the numbers behind the charts, including the input and output costs the charts fold into a single total. The first column is named after the current grouping, and sorting or paging the table asks the provider again rather than reordering the rows already on screen.
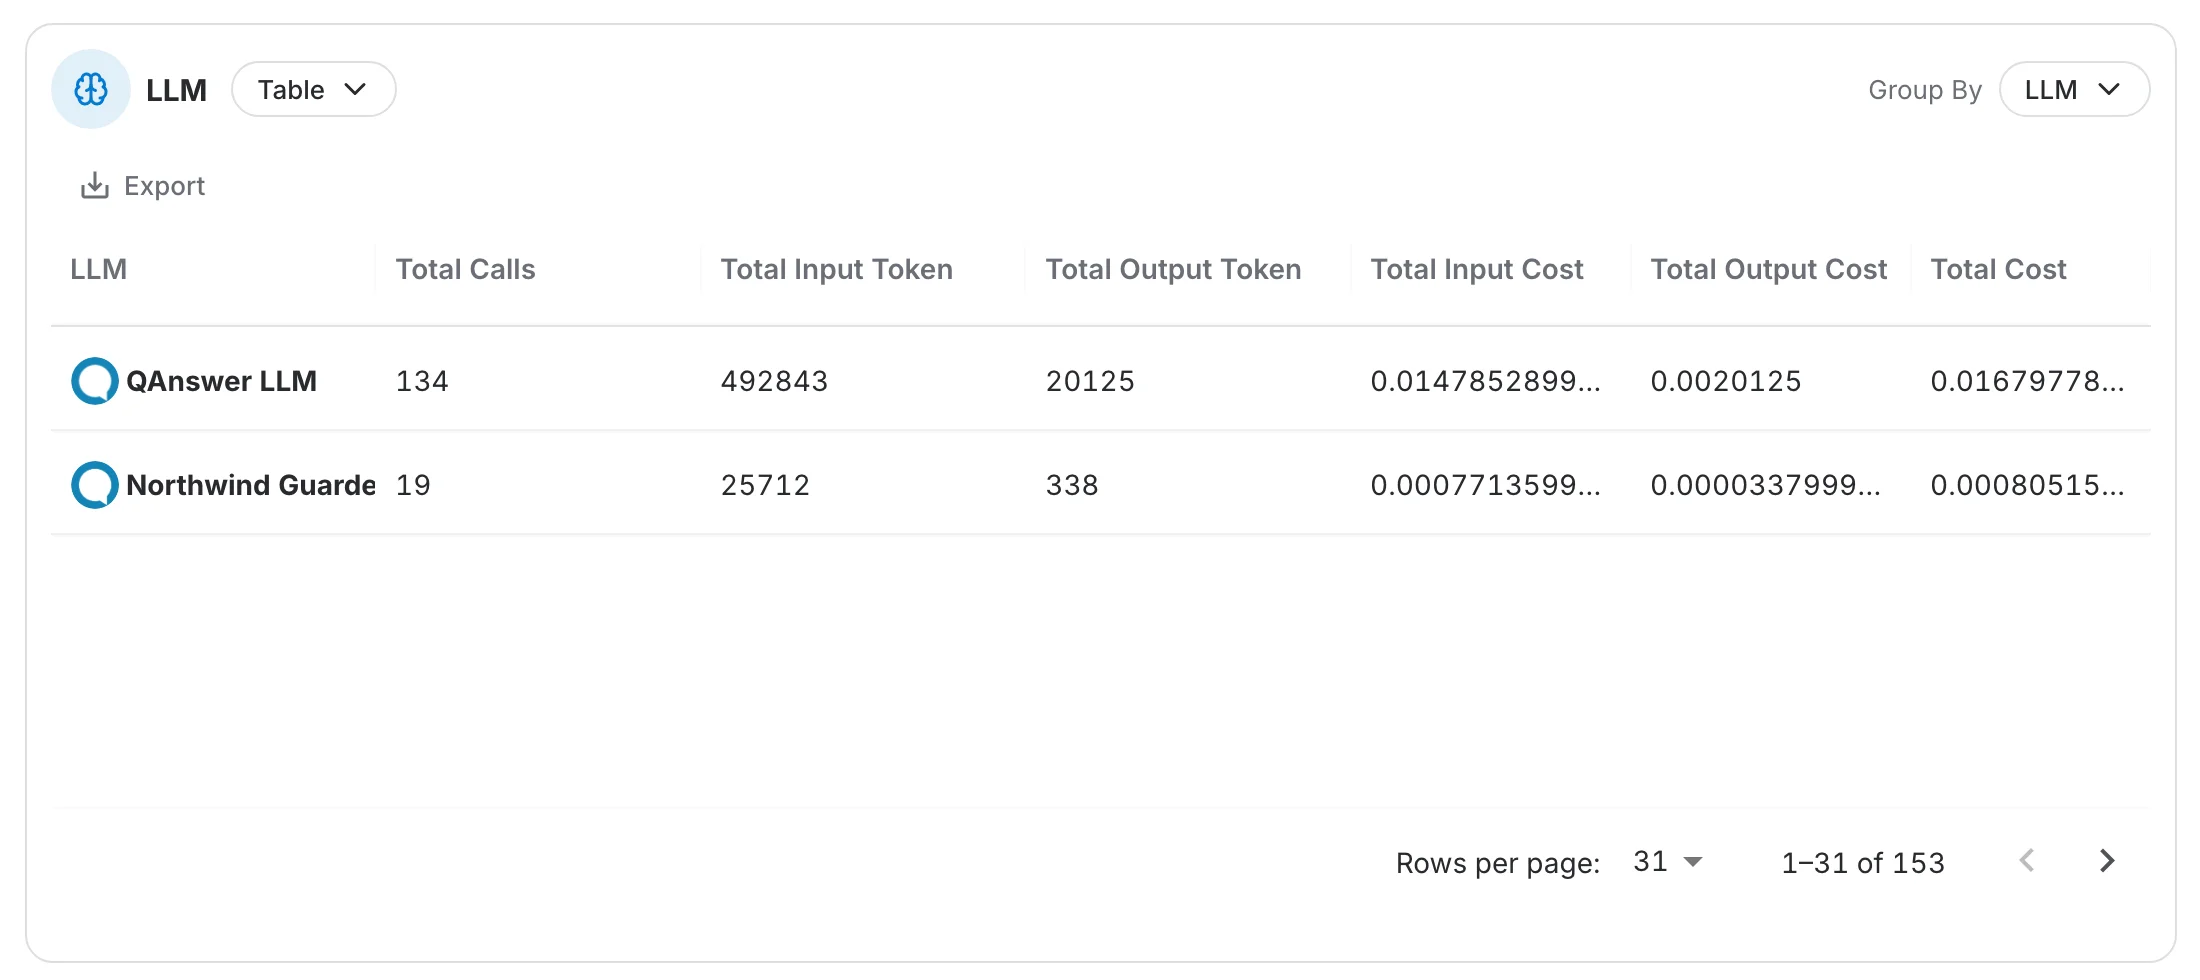
Use Export on the Table view to download what the card is showing as a CSV.
QAnswer multiplies the tokens it counted by the prices stored on the provider. Self-hosted models are usually left at zero, which is why they show €0.00 even though they were used heavily.